When a failure is not a surprise, but a recurring pattern
A line runs steadily for several days, and then the same feeder stops again. The technician replaces the component, production resumes, and the report is closed. A week later, the same situation happens again. Then again. Each time, the failure looks like a separate event, but from the perspective of data, something else becomes visible: the machine fails in a predictable rhythm.
This is where MTBF, or Mean Time Between Failures, becomes important. It is one of the key indicators for maintenance teams because it helps answer a critical question: how long does a machine, line or component operate without failure?
In serial production, MTBF is not just a technical number in a report. It is information about process stability, preventive maintenance quality, machine condition and the risk of future stoppages.
What is MTBF?
MTBF, or Mean Time Between Failures, means the average operating time between failures. The indicator is most often used for machines, lines, workstations or components that are repaired after a failure and then returned to operation.
In reliability and maintenance literature, MTBF is related to reliability, technical availability and failure analysis [1][2]. In production practice, it helps assess whether a given machine operates steadily or whether failures occur too often.
In simple terms:
MTTR shows how long the repair takes.
MTBF shows how long the machine operates between failures.
Both indicators are important, but they answer different questions.
MTTR asks: How quickly do we restore the machine to operation?
MTBF asks: How often does the machine stop working?
Only together do they provide a fuller picture of reliability and maintenance performance.
How to calculate MTBF?
The basic formula is:
MTBF = total operating time / number of failures
Example:
A machine operated for 300 hours in a month. During that time, 6 failures occurred.
MTBF = 300 hours / 6 failures = 50 hours
This means that, on average, a failure occurred every 50 hours of operation.
At first glance, the indicator is simple. In practice, however, several rules must be defined:
- whether you count calendar time or only actual machine operating time,
- which events are classified as failures,
- whether micro-stoppages are included in the calculation,
- whether MTBF is calculated for the entire line or for a specific component,
- whether all failures are analyzed together or by category.
Without these rules, MTBF can be misleading. One company may count only serious failures that stop the line, while another may also include short stoppages requiring operator intervention. The results will not be comparable, even if the machines operate in similar conditions.
MTBF and MTTR — two indicators that should be read together
MTBF and MTTR are often analyzed separately, but they provide the greatest value when interpreted together.
Example:
Machine A fails rarely, but each failure takes a long time to repair.
Machine B fails often, but repairs take only a few minutes.
Which machine is the bigger problem?
Without data on production impact, it is difficult to answer. Machine A may block the entire line for several hours, while Machine B may generate short but very frequent disruptions that reduce efficiency and engage operators.
In availability analysis, the relationship between failure-free operating time and repair time is often used. In a simplified approach, technical availability can be analyzed by comparing MTBF and MTTR [1][2].
The longer the MTBF and the shorter the MTTR, the better the availability.
The shorter the MTBF and the longer the MTTR, the greater the production risk.
In practice, it is useful to look at four scenarios:
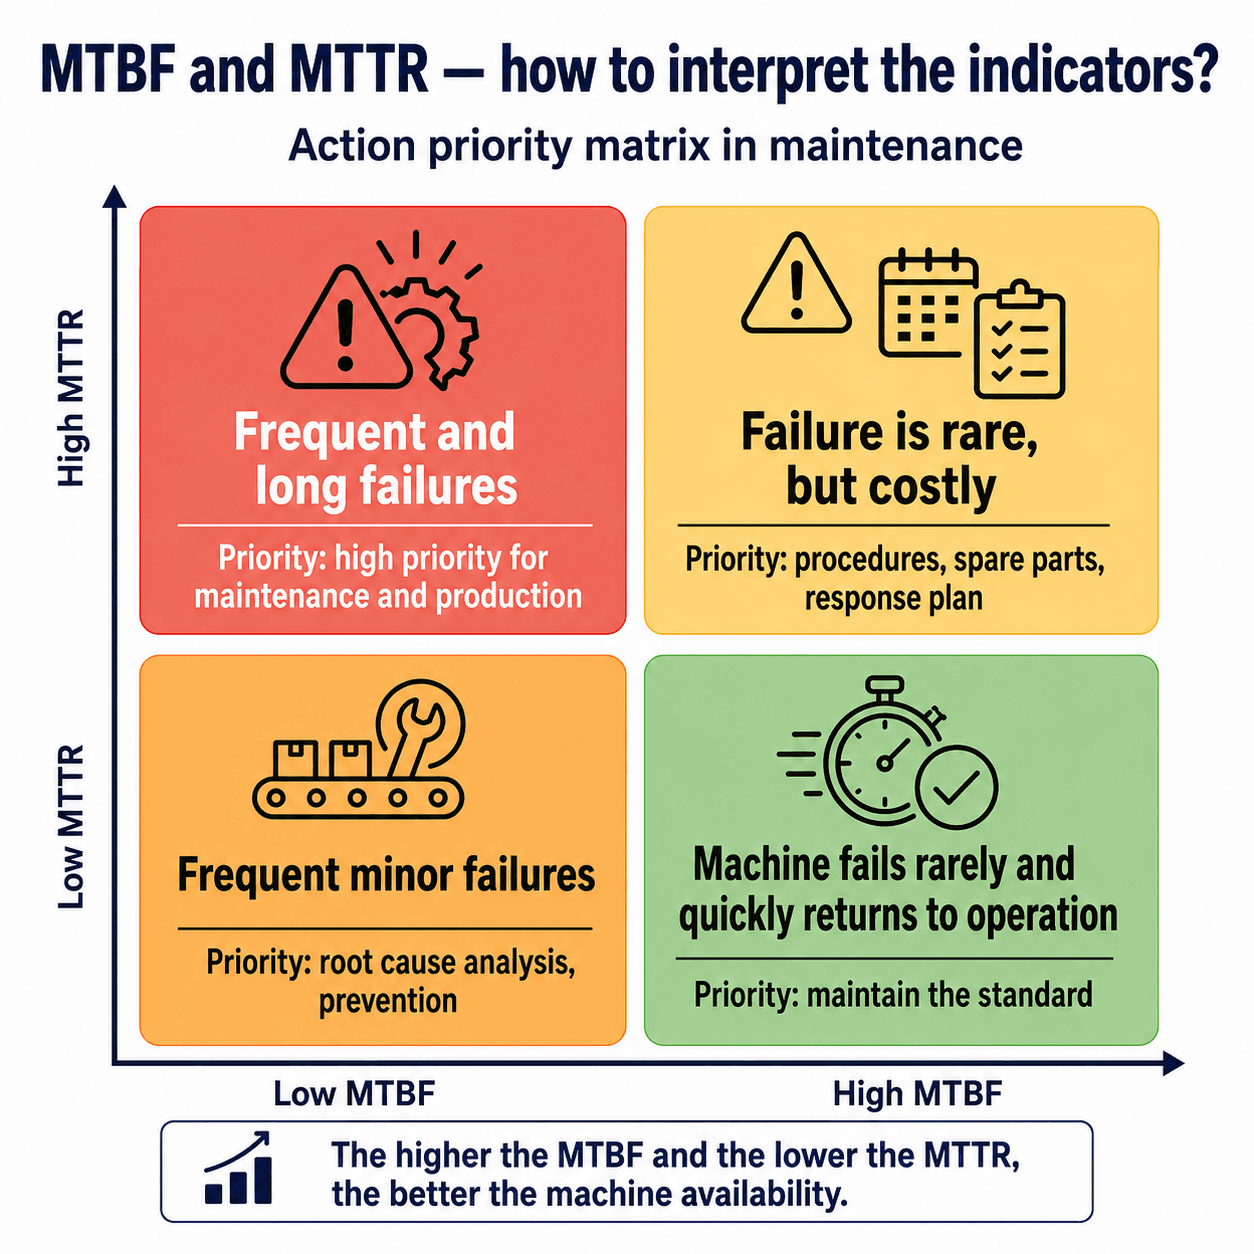
This kind of analysis helps avoid a common mistake: focusing only on the longest failures, while the real losses may come from frequent and repetitive events.
Why does MTBF matter for OEE?
OEE depends on availability, performance and quality. MTBF mainly affects availability, because it shows how often a machine interrupts production due to failure.
In TPM, or Total Productive Maintenance, failures and unplanned stoppages are among the key losses that reduce production efficiency [3]. If MTBF decreases, it means that the machine is becoming less stable. Even if every repair is quick, repeated stoppages can reduce OEE, disrupt shift planning and increase pressure on the maintenance team.
Example:
If a workstation stops once every 200 hours, the problem may be acceptable. If, after a few months, MTBF drops to 80 hours, it is worth checking what has changed:
- component condition,
- material quality,
- process settings,
- machine load,
- preventive maintenance schedule,
- operator handling,
- spare parts availability.
MTBF is therefore an early warning indicator. It does not immediately explain the cause of the problem, but it shows that reliability is starting to deteriorate.
What most often lowers MTBF?
Low MTBF means that a machine or component fails frequently. The cause is not always technical wear. In serial production, repeated failures may result from many process, organizational and operational factors.
The most common reasons for falling MTBF include:
- lack of regular inspections,
- inspections performed formally, without real diagnosis,
- machine overload,
- incorrect process settings,
- change of material or component supplier,
- lack of analysis of recurring failures,
- improper operation by operators,
- lack of checklists and operating standards,
- delayed replacement of wear parts,
- closing work orders without describing the failure cause.
Research on maintenance performance measurement indicates that maintenance indicators should be connected with improvement actions, not treated only as reporting elements [4]. A decrease in MTBF does not fix anything by itself. Value appears when data leads to decisions: changing inspection schedules, updating procedures, training operators or performing root cause analysis.
How to improve MTBF in practice?
Improving MTBF does not mean expecting that “the machine will never fail”. In real production, failures will occur. The goal is to reduce repetitive, predictable and preventable failures through better prevention and data analysis.
Start with the most frequent failures, not the entire machine park
The biggest mistake is trying to analyze everything at once. It is better to select a few machines or workstations with the highest production impact and check:
- which failures occur most often,
- what the average time interval between them is,
- whether they involve the same components,
- whether they occur on a specific shift,
- whether they are related to material, format or order type.
The goal is not to create a perfect report, but to identify the first recurring patterns.
Separate random failures from repetitive ones
Not every failure has the same nature. Some events are random and difficult to predict. Others return regularly, but no one looks at them as a series.
If the same sensor, drive or feeder stops production every few days, it is no longer “just another failure”. It is a signal that the cause should be examined more deeply: operating conditions, installation, settings, part quality, load or operator handling.
Connect MTBF with work order history
MTBF shows the interval between failures, but it does not explain by itself why failures return. That is why it should be analyzed together with service work order history.
A well-described work order should include:
- symptoms,
- failure category,
- cause,
- actions taken,
- replaced parts,
- process parameters,
- conclusions for the future.
The concept of using experience from previous maintenance interventions to support future decisions is described as experience feedback [5]. In practice, this means that every failure should leave knowledge behind, not just a closed status.
Update preventive maintenance schedules
If MTBF for a specific component is systematically decreasing, the preventive maintenance schedule may no longer be appropriate. Perhaps an inspection performed every 8 weeks should be performed every 6 weeks. Perhaps frequency alone is not enough and the inspection scope needs to change.
MTBF helps move from prevention based on intuition to prevention based on data. It does not replace technicians’ experience, but it gives them a concrete signal: where to look for the cause and which elements should be monitored more closely.
Involve operators in observing early symptoms
Operators often notice symptoms before the system does: unusual noise, vibration, delayed component response or more frequent micro-stoppages. If these signals are not reported, maintenance learns about the problem only when the machine has already stopped.
That is why improving MTBF also starts with simple reporting of early warning signs. Digital Andon, workstation statuses, report categories and operator comments help detect problems before they turn into recurring failures.
How can AndonCloud support MTBF analysis?
AndonCloud can support MTBF analysis primarily by recording events, failure history and service work orders. If every report is recorded digitally, the company can check not only how long the repair took, but also how often a given problem returns.
Example:
An operator reports a feeder failure on a packaging line. The system records the event time, workstation, category, comment and status. A service work order is created in the CMMS module. The technician adds the cause, actions taken and replaced parts. After a few weeks, the maintenance manager sees that a similar event occurs on average every 60 operating hours.
This is no longer a single failure. It is a pattern that can be analyzed.
AndonCloud can support work on MTBF through:
- digital failure reporting,
- workstation statuses,
- event comments,
- automatic notifications,
- service work orders in CMMS,
- work order history,
- procedure templates,
- recurring work orders,
- event reporting,
- analysis of recurring failures.
As a result, the maintenance manager can more easily answer questions such as:
- which machines fail most often?
- what is the average time between failures?
- do failures involve the same components?
- does the problem appear after a specific operating time?
- is the preventive maintenance schedule set correctly?
- does the failure return despite repair?
The system does not eliminate failures simply by being implemented. It helps build a process in which failures are visible, measurable and possible to analyze.
MTBF as a conversation tool between production and maintenance
In many companies, the discussion about failures starts only when production fails to meet the plan. Production sees stoppages, maintenance sees the number of interventions, and management sees a drop in efficiency. MTBF can help structure this conversation because it shows failure frequency in numerical form.
Instead of saying:
This machine keeps breaking down.
You can say:
Over the last three months, the MTBF of this machine dropped from 120 to 65 hours, and most failures concern the feeding system.
That is a completely different level of discussion. Data helps set priorities, plan actions and evaluate whether a procedure change or preventive maintenance schedule update actually improved the situation.
MTBF is therefore not only a technical indicator. It is a tool for jointly managing availability, risk and prevention.
Where to start working on MTBF?
It is best to start with a small, specific area. There is no need to calculate MTBF for the entire plant immediately.
A practical sequence may look like this:
- Select one line or a group of critical machines.
- Define what you classify as a failure.
- Decide whether you count calendar time or machine operating time.
- Collect failure data from the last 1–3 months.
- Calculate MTBF for the most common failure categories.
- Check which failures return at similar time intervals.
- Compare the data with work order history and preventive maintenance schedules.
- Select 2–3 preventive actions and observe how the indicator changes.
The most important thing is to keep one definition and collect data consistently. Even a simple MTBF calculated regularly is more valuable than an advanced report created once a quarter from incomplete information.
Summary
MTBF in serial production shows how long a machine, line or component operates between failures. It is one of the key reliability indicators, but its value depends on data quality and interpretation.
The indicator itself does not answer why failures occur. It shows where to look for the problem: components, operating conditions, procedures, inspections, operator handling or the history of previous interventions.
MTBF provides the greatest value when analyzed together with MTTR, OEE, work order history and failure categories. Then it stops being just a number in a report and becomes a tool for planning prevention, improving reliability and strengthening cooperation between production and maintenance.
AndonCloud can support this process through digital failure reporting, event registration, service work orders, procedures, intervention history and reporting. This helps the company not only respond to failures faster, but also better understand why they return.
Sources
[1] EN 13306. Maintenance — Maintenance terminology. European Committee for Standardization.
[2] IEC 60050-192. International Electrotechnical Vocabulary — Part 192: Dependability. International Electrotechnical Commission.
[3] Nakajima, S. (1988). Introduction to TPM: Total Productive Maintenance. Productivity Press.
[4] Muchiri, P., Pintelon, L., Gelders, L., & Martin, H. (2011). Development of maintenance function performance measurement framework and indicators. International Journal of Production Economics, 131(1), 295–302.
[5] Ruiz, P. P., Kamsu-Foguem, B., & Grabot, B. (2014). Generating knowledge in maintenance from Experience Feedback. Knowledge-Based Systems, 68, 4–20.
[6] ISO 22400-2. Automation systems and integration — Key performance indicators for manufacturing operations management — Part 2: Definitions and descriptions. International Organization for Standardization.
Pre-publication note: it is worth technically verifying the current editions of EN/IEC/ISO standards and the full bibliographic details of the scientific publications before publishing.