
Failure analysis
Causes, times and dependencies - failure analysis supports real-time UR activities
Automatic classification and prediction
Smart Status AI analyzes the current context and history of events to suggest the most relevant statuses. The more data, the better the recommendations.
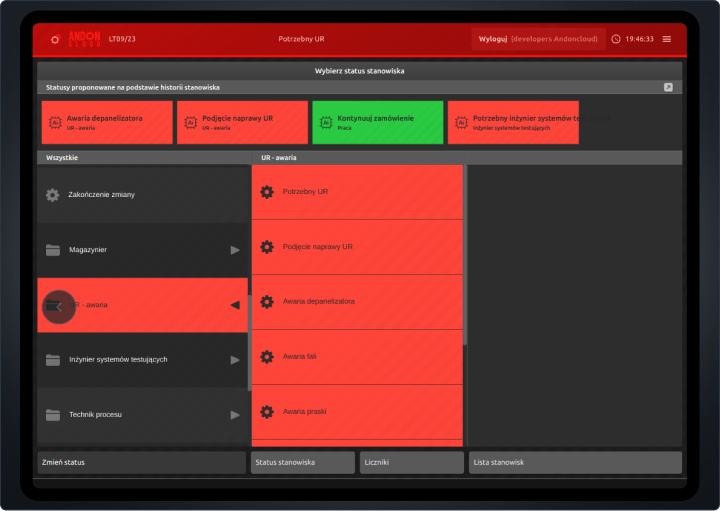
Faster recognition of the type of failure
The operator does not select a status from the full catalog, but from a list of prompts generated by AI. The system analyzes history and current data to reduce response time.
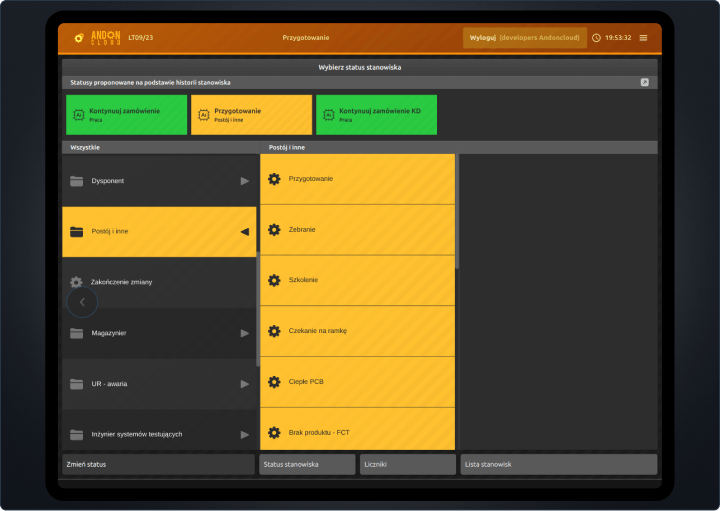
A model that learns from job data
SmartStatus AI learns from operators' manual choices. When there are fewer events, the system analyzes the context to display the most relevant prompts.
Implementation control by the administrator
AI recommendations can be enabled or disabled for the entire organization or a single position - configuration is done in the admin panel.
Distinguish between emergency and planned downtime
The system allows you to assign statuses to event types: failure, planned or unplanned interruption. This allows you to report exactly what actually happened on the line.
Clear breakdown of outage types
The administrator can assign an event type to each status - the data in the reports is unambiguous.
Better interpretation of efficiency
With classification, you can separate failures from scheduled activities and realistically assess MTTR, uptime or availability.
Reliable data for KPI analysis
Categorization avoids a situation in which a mislabeled outage affects the teams' performance evaluation.
Data visualization and correlations over time
Statuses are presented in charts and dashboards, in a form that is easy to read for operators and staff. Trends can be analyzed, anomalies can be looked for, and data can be correlated with other metrics.
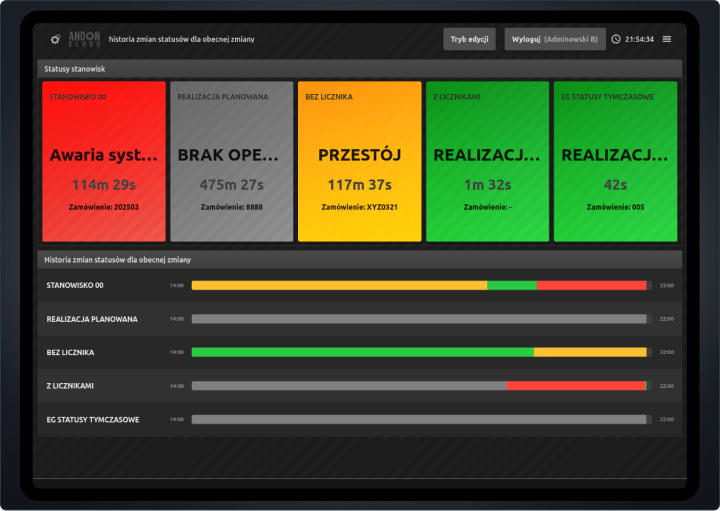
Color timelines and alerts
At the stations and in the system, the colors show the type of incident. The operator immediately knows to respond.
Dashboards and trend charts
The user can see a history of status changes, failure rate charts and can observe repetitive patterns.
Correlation with production efficiency
The system allows to juxtapose emergency data with production data and detect deviations from the norm.
Support for UR teams to quickly diagnose and eliminate problems
The system enables UR teams to quickly analyze repetitive defects, classify them and identify root causes. All data is linked to time, user and position.
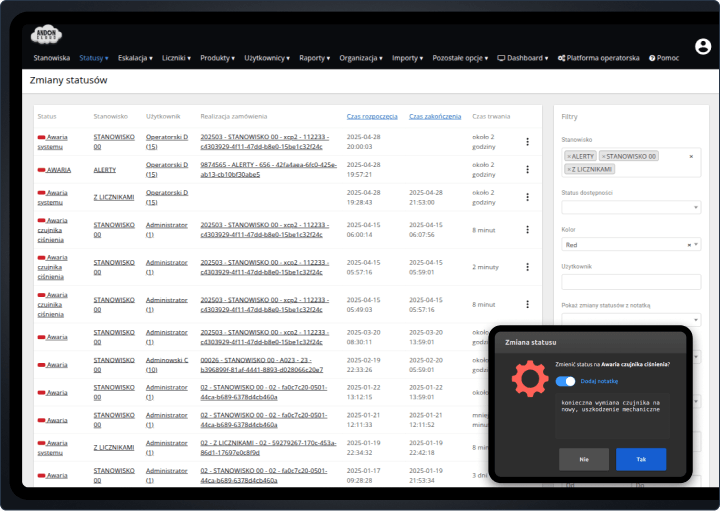
History of events by type and source
The UR team can see the entire history of failures and outages - broken down by source, machine and time. This makes cyclicality analysis easier.
Filter history by source of failure
The system allows filtering of emergency data by machine, event type, time and user. This makes it easier to analyze cyclicality and identify recurring problems.
Ability to assign actions and comments
Corrective actions or comments can be assigned to each failure. The system remembers who added them and when - UR has full context.
System
Our system is intuitive, but you can always count on us
We help your team work more efficiently every day.
Documentation
Develop your skills with our guides and tutorials to get the most out of AndonCloud.
Customer support
Get help by contacting our technical support team by phone or email.Monday - Friday; 9:00 - 17:00support@andoncloud.comMonday - Friday; 9:00 - 17:00+48 71 340 70 32
Integrations
Integrate with over 5,227 third-party apps and tools.
Have questions for our sales team?
Call us and we will guide you through the process.+48 71 340 70 15
FAQ
Frequently asked questions
- The system analyzes the previous statuses and the current context of the workstation. Based on this, it suggests the most likely next statuses to the operator.
- No - he receives a short list of suggestions automatically generated from the hall data.
- Event history, production context and operators' manual choices on previous requests.
- Yes - the system prompts based on previous manual decisions of operators. You can always select a different status manually.
- No - it is part of the system and activated according to the configuration of the account or position.
- The type of event is assigned to the status - failure, planned or unplanned interruption.
- The system administrator defines the types for each status in the configuration.
- It avoids misrepresentations in reports and better assesses the effectiveness of teams.
- No - the type is recorded at the time of notification, which ensures the reliability of the data.
- Correct classification allows better analysis of repair time and machine availability.
- In the form of colorful statuses, charts on the dashboard and email/SMS alerts.
- Yes - the colors on the station screen show the current status of the device.
- Yes - you can juxtapose the statuses with the planned performance and check the impact of the failure.
- Dashboards, status timelines and trend chart widgets.
- Yes - trend and deviation analysis makes it possible to detect anomalies in the operation of the line.
- Yes - all events are recorded with date, source and user.
- Yes - the system allows an overview of failures by type, source, machine or day of the week.
- Pareto report, full status classification, tags and the ability to assign actions.
- Yes - you can add a description, actions or findings to each event.
- Yes - the history is filterable by date, position, source and type of problem.
AndonCloud's failure analysis allows UR teams to identify causes of failures faster and reduce downtime.
By classifying events and using Smart Status AI algorithms, it is possible to predict subsequent statuses based on previous manual choices by operators. The system suggests the most likely scenarios, which reduces response time and errors.
AndonCloud distinguishes between failures and planned and unplanned outages, which improves the quality of reports and allows better measurement of uptime, MTTR and other performance indicators. Data is visualized on color-coded timelines, dashboards, and in daily and weekly reports. Users can analyze trends, detect anomalies and track correlations between events.
The system also supports UR teams in diagnosing and eliminating problems - with event histories, Pareto reports and the ability to assign actions and comments.
Contact
Contact us
If you have any questions, talk to our expert
We will respond within the next business day
sales@andoncloud.comPhone
Monday - Friday; 9:00 - 17:00
+48 71 340 70 15Make an appointment

Marcin Wierzbicki
During the meeting, we will present the product and help you configure the system in your company efficiently and quickly. Our team is at your disposal.
Newsletter
Sign up for the newsletter
Want to stay up to date? Sign up for our database.
By subscribing to our newsletter, you agree to our Privacy Policy and to receive updates from our company.