
Monitoring panel
The monitoring dashboard presents live key data, supports rapid response and operational goals.
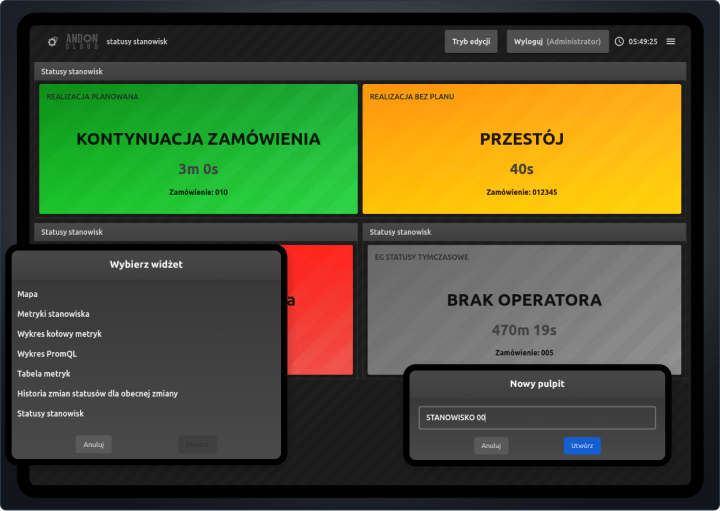
Create dynamic dashboards
The operator only enters key information, while the rest of the data is automatically retrieved from machines and sensors. This makes production recording faster, more accurate and significantly reduces the workload for operators.
Data visualization tailored to the user
You can create charts, indicators, and widgets that display key information for a given position. This allows each user to see exactly the data they need without unnecessary clicks.
Live production data
Dashboard aktualizuje wartości w czasie niemal rzeczywistym, co pozwala reagować natychmiast na zmiany w produkcji. Użytkownicy widzą aktualną liczbę sztuk, tempo pracy i odchylenia.
Content that fits the context
You can prepare separate views for different job groups or departments, so that everyone can see the information that is most important to their area. Everything is always clear and up to date.
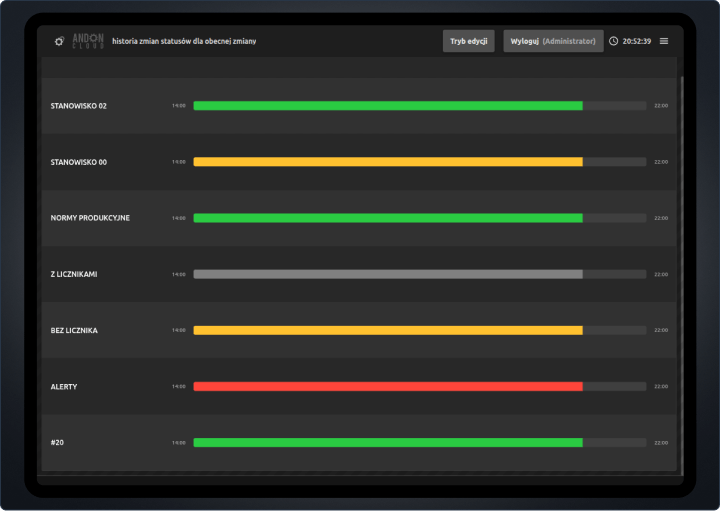
Timeline of position activity - full visibility of events
The timeline collects detailed history of machine and operator performance, presenting it in a clear format. It enables analysis of each shift, detection of deviations and quick diagnosis of problems. The tool shows both micro-downtime and longer breaks, making it easier to identify areas for improvement. This gives management a complete picture of production efficiency.
Visualize the course of change
The timeline shows the sequence and duration of activities, breaks, and downtime during each shift. This helps to easily identify inefficiencies and delays.
Transparent work history
It allows you to view the entire history of the line from a bird's eye view. It allows you to understand the entire change in a few seconds. Unusual events and long breaks are immediately visible.
Step-by-step status overview
You can track every status that appeared during the change. The tool allows you to analyse the entire course of the change without having to switch to the operator panel.
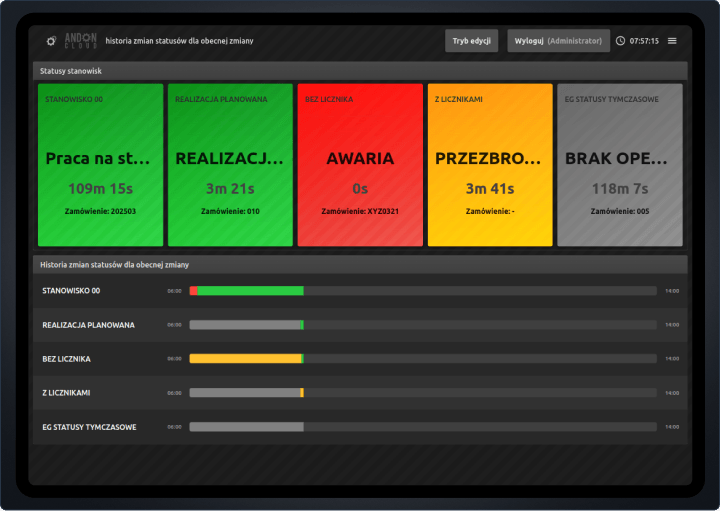
Timeline of position activity - full visibility of events
The dashboard provides an instant overview of production line statuses thanks to a system of colours and icons. This makes it easier for operators and managers to quickly assess the situation and respond to potential problems. The solution works on both monitors and large screens in the hall. It replaces traditional Andon lamps with a more readable and precise visualisation.
Instant status overview
The dashboard screen displays colours and symbols indicating whether the machine is operating, whether there has been a failure, or whether there is a break. One glance is all it takes.
Visibility where it's needed
Statuses can be displayed on screens in the production hall. Employees can see the necessary data without having to move between workstations and check.
Modern alternative to Andon lamps
Electronic indicators on the monitor replace traditional signal lamps and are more visible. They also provide more detailed information about the status of the line.
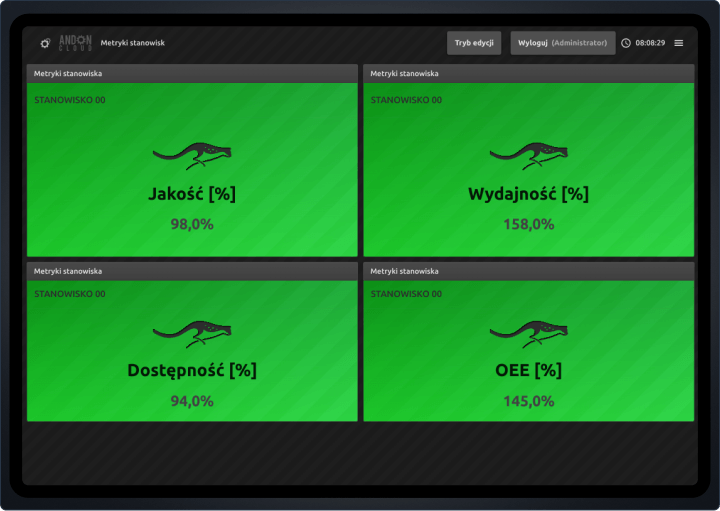
Manufacturing job metrics - the complete picture of KPIs
The monitoring panel provides detailed data on the efficiency, availability and quality of processes. Users can track OEE, defect rates and production rates in real time. The data is presented in a clear format, which supports quick operational decisions. The system allows the indicators to be personalised for different user groups.
Tabular presentation of data
Basic production metrics (e.g. OEE, productivity, defect rate) are displayed in tables updated in real time. This allows you to quickly assess the current status of processes.
Personalization of data coverage
The user decides which metrics and positions are to be displayed. This ensures that the dashboard only shows the most important information.
Intuitive interpretation through colors
Green, yellow and red colors indicate the level of achievement of production goals - you quickly know what is working well and what needs attention.
System
Our system is intuitive, but you can always count on us
We help your team work more efficiently every day.
Documentation
Customer support
Integrations
FAQ
Frequently asked questions
- To create a new dashboard, click the “Blank Dashboard” option on the home page or go through the admin panel → “Other Options” tab → “Dashboards” → “Create dashboard”.
- Yes, editing the name or content of a dashboard is possible from the admin panel - just select the appropriate dashboard from the list and use the “Edit” option.
- Once in edit mode, you can add widgets, set them in any layout and resize them - there are icons next to each widget for this purpose.
- Yes, an administrator can create multiple dashboards, assigning them to different positions, departments or screens on the shop floor.
- The dashboard presents data practically in real time (with a delay of about 15 seconds), which allows ongoing monitoring of production.
- It shows a list of jobs with a currently set status, such as “Breakdown” or “Service,” so you can quickly identify problems.
- In edit mode, select the widget “View job statuses” → “Create” → select the colors of the statuses and the positions to be monitored.
- Yes, the user can manually select specific positions and statuses of interest - this way the dashboard shows only relevant data.
- It also shows the duration of the current status and the number of the order being processed at the position.
- It allows you to remotely track critical statuses and respond immediately, without having to be physically present at your workstation - a modern alternative to Andon lights.
- This tool visualizes changes in job statuses during the current production shift - from the beginning of the shift to the present.
- It shows the sequence of status changes by color (e.g. green - operation, red - failure) and their duration.
- It is most often used by production managers, who analyze the course of the shift and talk to the team about possible irregularities.
- Yes, detailed data is available from the platform and the admin panel, where you can analyze longer periods, such as a whole week.
- It allows you to identify problematic periods and take optimization measures based on historical data.
- This is a tabular presentation of key indicators (KPIs) assigned to selected jobs, such as productivity, quality or downtime.
- There are dozens of metrics to choose from, including availability, OEE, good/bad pieces, time to failure - and others configured in the system.
- In edit mode, select positions and assign metrics to them from the list - the widget will immediately start downloading real-time data.
- The colors (green, yellow, red) support quick analysis of the situation - they correspond to the current condition of the position or process.
- Yes - the system updates data every 15 seconds or so, so users have access to up-to-date information almost live.
With the ability to create fully customizable dashboards, companies can present key performance indicators (KPIs) directly on shop floor screens, increasing team engagement and supporting the achievement of common goals. The job status viewer is a modern alternative to traditional Andon lights - it provides a quick view of current statuses, breakdown time or order in progress in a transparent way, accessible from anywhere in the plant.
The job timeline allows you to analyze the progress of a production shift and quickly catch irregularities. Visible job metrics in the form of a clear table present production data - such as availability, quality, downtime, OEE - for selected jobs. The system also includes dozens of other widgets to monitor and analyze various aspects of production processes. AndonCloud's solutions support effective production management, increase operational efficiency and enable rapid response to changing working conditions.
Contact
Contact us
If you have any questions, talk to our expert
We will respond within the next business day
sales@andoncloud.comPhone
Monday - Friday; 9:00 - 17:00
+48 71 340 70 15
Marcin Wierzbicki
During the meeting, we will present the product and help you configure the system in your company efficiently and quickly. Our team is at your disposal.
Newsletter
Sign up for the newsletter
Want to stay up to date? Sign up for our database.
By subscribing to our newsletter, you agree to our Privacy Policy and to receive updates from our company.