Business Intelligence in manufacturing – from data to decisions
Modern manufacturing generates unimaginable amounts of data. According to estimates by the McKinsey Global Institute, industrial plants produce approximately 1.9 petabytes of information per year. Sensors, MES, SCADA, and ERP systems alone generate hundreds of thousands of records per day. However, without the right analytical tools, this data remains useless.
This is where Business Intelligence (BI) systems come in. They allow raw data to be transformed into knowledge and real business decisions.
The growing importance of BI is best illustrated by the numbers. The global market for Business Intelligence systems dedicated to manufacturing was valued at $12.5 billion in 2024. Forecasts indicate that by 2033, its value will double to $25.3 billion, representing an average annual growth of approximately 8.5% (Verified Market Reports, 2024). This is a clear signal that manufacturing companies are investing heavily in analytical tools, knowing that without them it is difficult to optimize processes and remain competitive.
What's more, more than half of manufacturing plants (about 58%) already use cloud-based BI solutions. The cloud trend is no coincidence, as the cloud facilitates the integration of data from multiple sources, allows for scaling as needed, and reduces infrastructure costs.
Stages and key elements of Business Intelligence in manufacturing
Business Intelligence in the manufacturing sector covers the entire process of transforming data into knowledge – from its collection and integration, through various types of analysis, to visualization and practical use in everyday management. Each of these stages has a different function, but only together do they form a coherent whole that allows companies not only to report on the past, but also to diagnose problems, predict future events, and make decisions that increase efficiency and profitability.
Data collection from various sources: IoT sensors, devices, MES, SCADA, ERP, and Quality Management Systems
Data integration: the process of combining data from multiple sources to create a common repository, a single, unified view where information is ready for analysis. Data integration helps to significantly consolidate all types of data, taking into account its growth, volume, and all its different formats. By combining information into a single coherent set, companies can provide their internal departments with better insight into business processes, strategies, and decisions.
Data analysis: the use of various analytical methods, from simple historical reports to diagnostic, predictive, and prescriptive analyses: Descriptive analytics – answers the question: "What happened?" These are classic historical reports, e.g., the number of units produced in a given period, downtime, or OEE in the past month. They allow managers to see past results and basic trends. Diagnostic analytics – answers the question: "Why did it happen?" This involves analyzing the causes of problems: e.g., why a given line had more defects, what caused the downtime, or what contributed to the decline in productivity. BI allows you to combine data from different sources and detect hidden relationships that are difficult to spot manually. Predictive analytics – answers the question: "What will happen?". In this case, BI systems use statistical algorithms and artificial intelligence to predict future events. An example from manufacturing: based on data from sensors, the system can indicate that a particular machine will soon fail or that the defect rate will increase at the current rate of operation. Prescriptive analytics – answers the question: "What should we do?" This is the most advanced level, where the system not only predicts events but also suggests optimal actions. For example, it may recommend rescheduling maintenance, changing employee allocations, or modifying process parameters to prevent problems and increase efficiency.
By combining these four levels of analytics, companies gain the ability not only to report on the past, but also to explain the causes of problems, predict future events, and identify the best solutions. This is the path from simple data collection to full operational intelligence on the production floor.
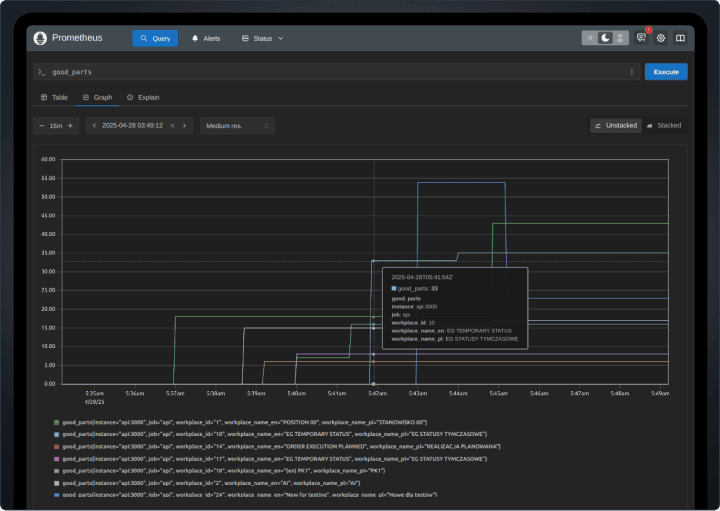
Visualization: Displaying processed data using reports, dashboards, charts, floor and machine plans, and operational statuses.
Knowledge-based action based on conclusions: using the conclusions obtained to identify opportunities for improvement and implement strategies to increase efficiency, reduce costs, and improve profitability.
BI functionalities. What should a good production system offer?
Aggregation of data from multiple sources: Data from IoT sensors, machine stations, MES/ERP/SCADA systems, computer vision, external services. Example: When analyzing data from a single machine, it is easy to overlook dependencies related to conditions on the shop floor or operator changes. Only by aggregating multiple sources can hidden downtime patterns be detected.
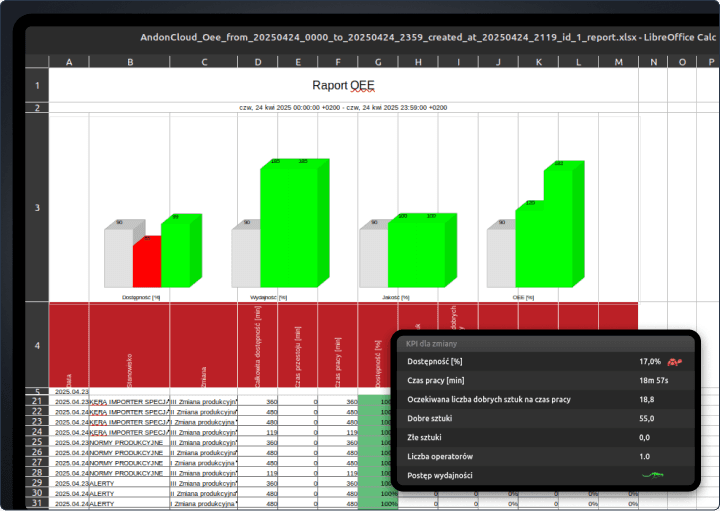
Automatic and manual reporting: Daily/hourly reports on attendance, downtime, defects, and compliance with standards. In addition, the systems send alerts. For example, when downtime exceeds a set threshold. This allows for a quick response and reduces time loss.
Real-time data visualization: Dashboards, hall plans, workstation statuses, trend charts. Everything is refreshed in real/near-real time. This allows the hall manager to spot delays on the line in time and direct additional resources where they are needed, minimizing the costs of downtime.
Predictive analytics: Prediction allows you to detect trends, anticipate failures, and propose recommendations for preventive actions. Example: if sensors detect early signs of a vibration damper failure, the system can suggest preventive maintenance before a serious downtime occurs.
Data mining – discovering relationships and patterns: Analysis of historical data allows you to find relationships that are not immediately apparent. This could be a relationship between the number of defects and a specific work shift, the influence of temperature, or the quality of raw materials. Knowledge of such relationships allows corrective action to be taken, e.g., better scheduling of shifts or changing material suppliers.
Interpretable data and context: Raw numerical data is not always sufficient for decision-making. That is why BI systems increasingly provide information in context – along with metadata, annotations, and additional descriptions, such as the causes of downtime or operator comments. This allows managers to not only see the effects, but also to more easily understand their causes, which supports accurate operational decision-making.
Integration with CMMS, SCADA, and MES systems Full efficiency requires a consistent flow of information. Integrating BI with existing systems such as SCADA, MES, or CMMS eliminates the need for manual data entry and ensures that data is always up to date. Example: if sensors on the production line indicate an anomaly, the system automatically generates a machine inspection or maintenance order in the CMMS module. At the same time, MES records a drop in performance and the maintenance manager receives a notification of the event. No delays and no risk of errors.
An analysis of the presented functionalities shows that an effective Business Intelligence system for manufacturing must combine several key elements: collecting data from multiple sources, automatic reporting, real-time presentation, and in-depth analysis – from diagnostic to predictive and prescriptive. The ability to discover relationships in historical data and ensure the interpretability of results also plays an important role, supporting accurate operational decision-making. This is complemented by integration with CMMS, SCADA, and MES systems, which guarantees consistency of information and eliminates the risk of errors resulting from manual data transfer.
All these elements are present in AndonCloud, making the platform a comprehensive analytical tool that supports production management.
The most common challenges and key success factors for BI
For BI to actually work and bring benefits, you also need to ensure:
Data quality and consistency – the effectiveness of analysis depends on whether the data is complete, up-to-date, and correctly integrated. Measurement errors, missing records, or duplicates can lead to false conclusions.
User adoption and data culture – simply implementing the system is not enough. Training, staff support, and the promotion of a data-driven culture are needed to ensure that dashboards and reports are actually used in everyday decisions.
Standardization of information sources – different systems (MES, SCADA, CMMS) often use different data formats; without standardization, integration and analysis are difficult.
Selection of appropriate KPIs – an excess of indicators makes it difficult to assess the situation, while too narrow a set does not show the full picture. It is crucial to select measures that are truly relevant to quality, efficiency, and costs.
Scalability and system maintenance – a BI system should be flexible, allowing for expansion with new production lines, machines, or data sources without the need for costly reconstruction.
Technological and infrastructural integration – appropriate sensors, an industrial network (e.g., stable and fast data transfer), IT/OT integration, and reliable hardware are the foundation of effective BI.
Data security – in an era of growing cyber threats, it is important that the BI system has security measures in place to protect production and infrastructure data.
Continuous improvement – BI implementation is a process, not a one-time project. Regular updates, analysis of user needs, and adaptation of the system to changing production realities are essential to maintain its value.
Summary
The days of manually compiling data from spreadsheets and separate systems are over. In today's manufacturing, the implementation of Business Intelligence (BI) has become a prerequisite for effective operation. BI allows you to reduce response times, better manage resources, reduce losses, and maintain high-quality processes. It is not only a tool for "reading" the past – thanks to diagnostic, predictive, and prescriptive analytics, it also enables understanding the causes of events, predicting problems, and proposing corrective actions. Companies that take advantage of these capabilities effectively prevent failures, optimize processes, reduce waste, and increase production line efficiency.